How to Reduce Rigid-Flex PCB Procurement Costs by 30%: 5 Strategies (2026)
Rigid-flex PCB procurement costs are typically 2–3× higher than standard rigid boards due to complex manufacturing processes. This guide provides five proven strategies—based on CAM engineering experience and real-world cost analysis—to reduce costs by up to 30% while maintaining design integrity.
Optimize Layer Stackup and Flex Region Design
The most significant cost driver is layer count in the flex region. Every additional layer increases material cost, lamination cycles, and complexity exponentially.
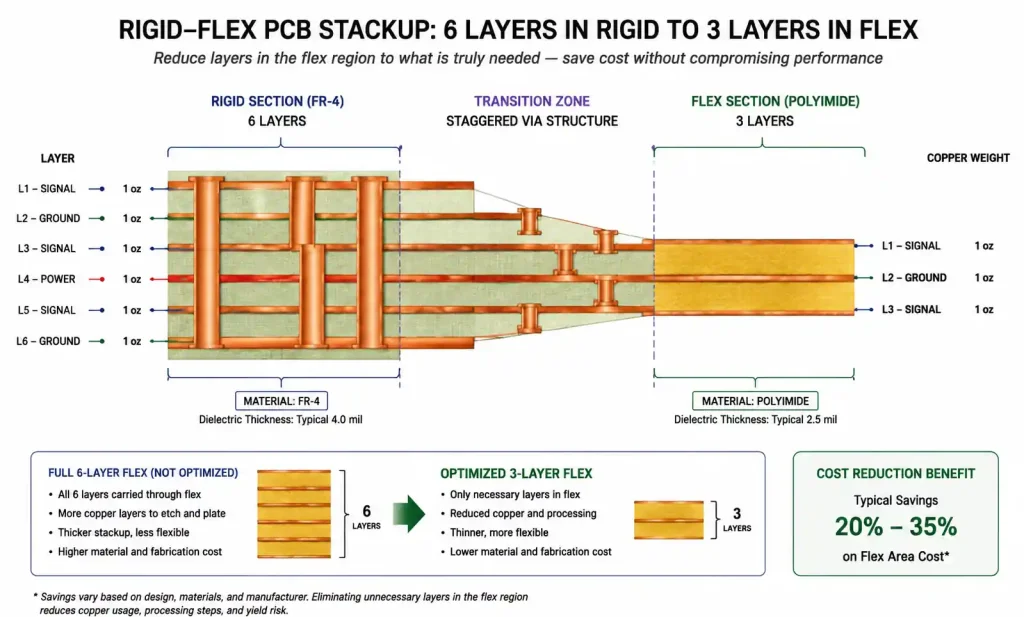
Reduce unnecessary flex layers. Many designs carry all rigid layers through the flex section when only signal/power layers are needed. A 6-layer rigid board requiring only two signal layers + ground in the flex area can transition to a 3-layer flex section, reducing material cost by 20–25%.
Minimize the number of flex regions. Each rigid-to-flex transition adds manufacturing steps. Consolidate multiple short flex sections into one longer region where possible.
Use staggered vias instead of through-vias in flex areas. Through-vias penetrating the entire flex section create stress points. Staggered vias in adjacent rigid sections eliminate this cost and improve reliability.
Specify larger bend radii. Minimum standard is 10× total flex thickness. If your design allows 15× or 20×, specify it—manufacturers use standard materials and reduce tooling costs.
| Design Parameter | Standard Approach | Cost-Optimized Approach | Cost Reduction |
|---|---|---|---|
| Flex layers (on 6L rigid board) | 6 layers through flex | 3 layers in flex region | 20–25% |
| Number of flex regions | 3 separate sections | 1 consolidated region | 10–15% |
| Via structure in flex | Through-vias all layers | Staggered vias in rigid sections | 8–12% |
| Bend radius | 10× thickness | 15× thickness or higher | 5–8% |
Choose Cost-Effective Materials Without Sacrificing Performance
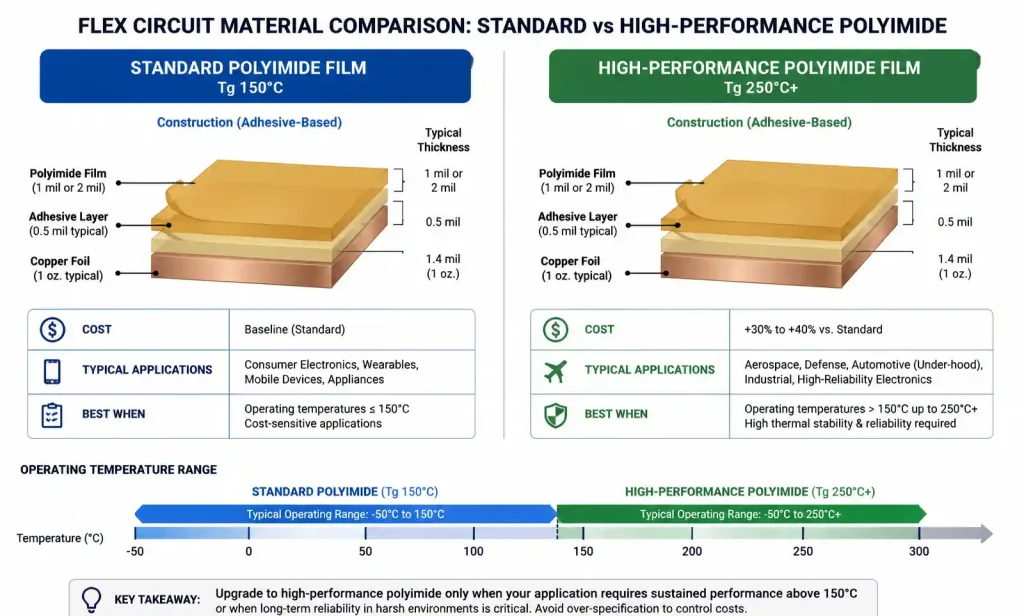
Use standard polyimide for flex layers. Standard polyimide (1–2 mil) suits most applications below 150°C. High-performance polyimide (Tg > 250°C) costs 30–40% more—only needed for aerospace, automotive underhood, or multiple lead-free reflow passes.
Select FR-4 for rigid sections. Unless sustained operation exceeds 130°C, standard FR-4 (Tg 130–140°C) offers excellent reliability at a fraction of high-Tg FR-4 (Tg 170°C+) cost.
Avoid adhesiveless flex unless cycle life exceeds 100,000 flexes. Adhesiveless costs 25–35% more. For static or limited-flex applications (<1,000 cycles), adhesive-based materials are adequate.
Use 1 oz copper in flex instead of ½ oz. Specifying 1 oz (35 µm) reduces cost by 10–15%—½ oz requires special handling and tighter process control.
| Material Choice | Standard Cost | Premium Cost | Upgrade Only If |
|---|---|---|---|
| Flex polyimide | $$ | $$$ (+30–40%) | Operating temp >150°C, multiple reflow passes |
| Rigid substrate | FR-4 Tg 130°C | High-Tg FR-4 170°C+ | Sustained operation >130°C |
| Flex construction | Adhesive-based | Adhesiveless (+25–35%) | Dynamic flexing >100,000 cycles |
| Copper weight | 1 oz (35 µm) | ½ oz (18 µm) | Extreme weight or bend radius <6× |
Relax Manufacturing Tolerances Where Possible
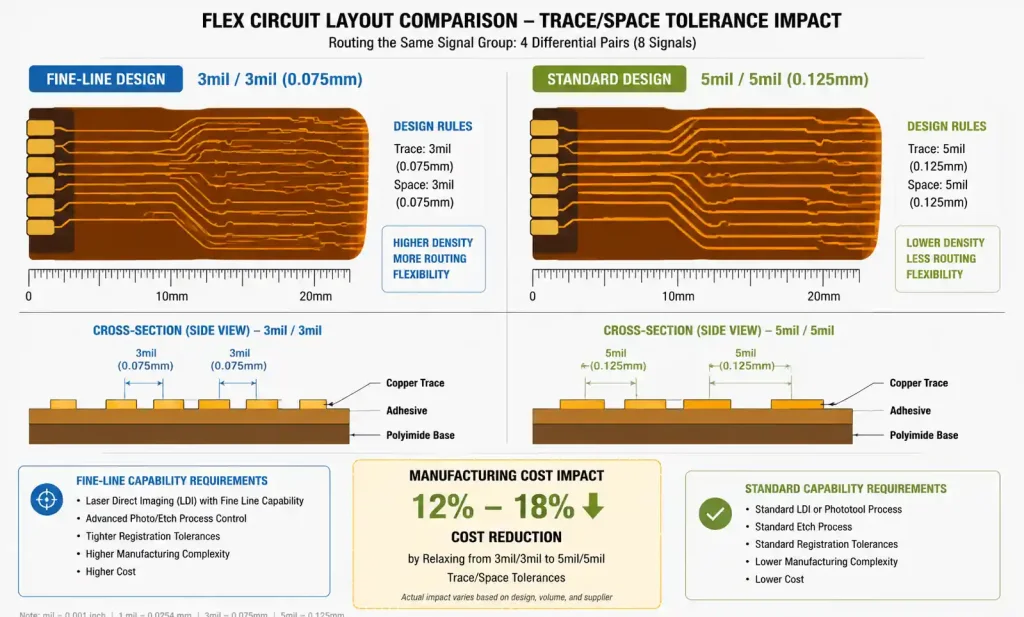
Increase minimum trace width/spacing. Moving from 4/4 mil to 5/5 mil reduces fabrication cost by 12–18%—it allows standard imaging/etching without fine-line capabilities.
Relax annular ring requirements. IPC-6012 Class 2 (2 mil) vs Class 3 (4 mil). If Class 3 isn’t required, specifying Class 2 reduces costs by 8–12%.
Use standard drill sizes. Consolidate to fewer than 5 unique sizes (0.3mm, 0.4mm, 0.5mm, 0.6mm, 0.8mm) to reduce drilling costs by 5–10%.
Specify standard surface finishes. ENIG with 2–3 µin gold (vs 5 µin) reduces cost by 6–10%. For non-wire-bonding applications, Immersion Silver or OSP cost 15–25% less than ENIG.
Allow standard thickness tolerances. Relaxing from ±10% to ±15% improves yield and reduces cost by 5–8%.
| Specification | Tight Tolerance | Relaxed (Standard) | Cost Impact |
|---|---|---|---|
| Trace width/spacing | 3/3 mil | 5/5 mil | 12–18% reduction |
| Annular ring | Class 3 (4 mil) | Class 2 (2 mil) | 8–12% reduction |
| Unique drill sizes | 8+ | 3–5 standard | 5–10% reduction |
| Gold thickness (ENIG) | 5 µin | 2–3 µin | 6–10% reduction |
| Overall thickness | ±10% | ±15% | 5–8% reduction |
Implement Smart Panelization and Order Volume Planning
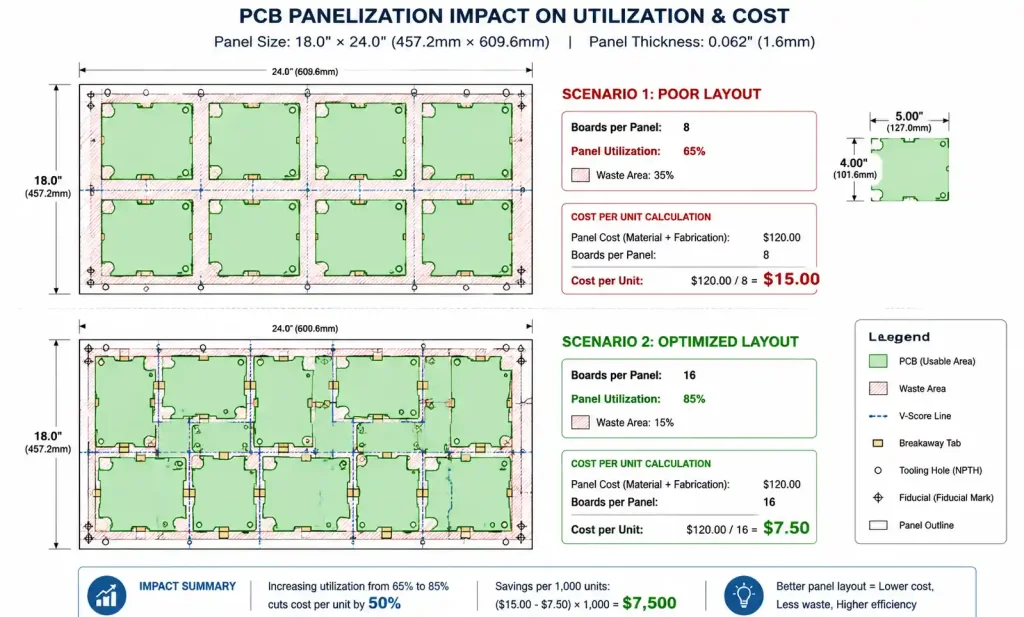
Optimize panel utilization. Rigid-flex boards are panelized on 12″ × 18″ or 18″ × 24″ panels. Achieving 80–85% utilization (vs 60–70%) reduces per-unit cost by 10–15%. Work with your manufacturer’s CAM engineer on board rotation, spacing, and array configuration.
Increase order quantity to amortize NRE. For 5–10 unit prototypes, NRE can represent 40–50% of total cost. Increasing to 25–50 units reduces NRE allocation per unit by 60–70%.
Consider multi-project panelization for prototypes. Shared panels reduce prototype costs by 30–40% (extends lead time by 1–2 weeks).
Engage volume manufacturers early. If scaling to 500+ units/year, volume manufacturer feedback prevents costly redesigns and can reduce prototype pricing by 15–20%.
Partner with DFM-Capable Suppliers Early
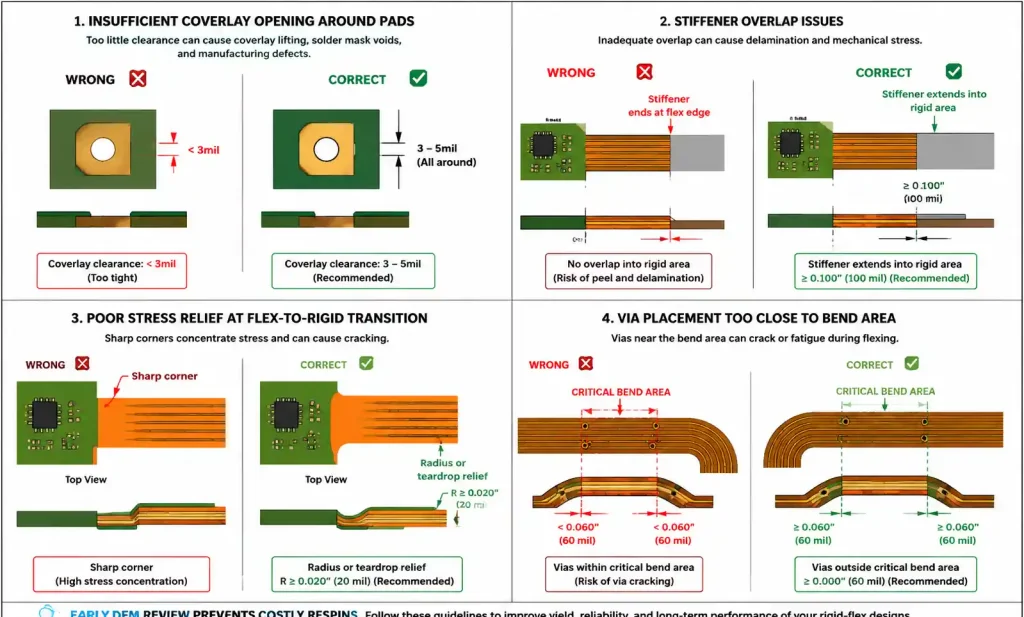
Request DFM review before finalizing layout. A thorough DFM review catches issues like improper coverlay, inadequate stiffener overlap, poor flex-to-rigid transitions, or insufficient stress relief—avoiding expensive respins.
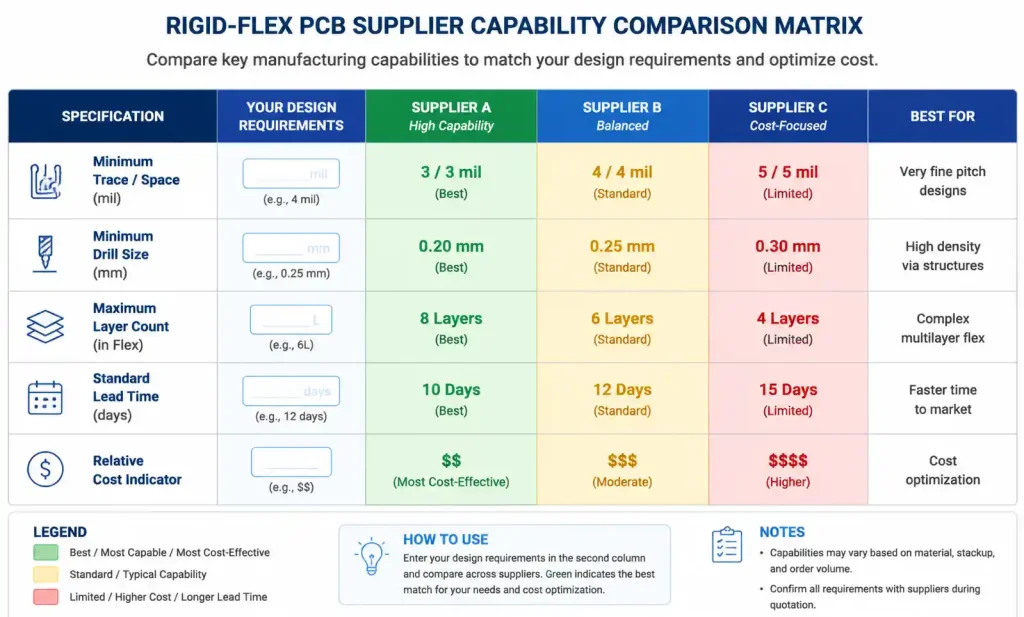
Match design to supplier capabilities. Some specialize in high-layer-count (8–12 layers), others in high-volume simpler constructions (4–6 layers). Matching your design to their sweet spot reduces costs by 15–25%.
Use supplier design guidelines and templates. Leading manufacturers provide stackup templates and material selection guides—reduces engineering queries and yield losses by 10–15%.
Evaluate multiple suppliers with detailed RFQs. Price differences of 20–40% for the same design are common. Provide complete Gerber files, stackup drawings, and IPC class requirements to at least 3 suppliers.
Build long-term supplier relationships. Consolidating with 1–2 preferred suppliers unlocks 10–15% relationship discounts, priority scheduling, and proactive engineering support.
FAQ
Typical cost difference: rigid-flex vs rigid PCB with connectors? Rigid-flex costs 2–3× more for low volumes (<100 units), but eliminates connector costs ($2–10/pair), assembly labor, and failure points. For volume >500 units in space-constrained or high-reliability applications, rigid-flex often achieves lower total system cost.
Can I use standard FR-4 in rigid sections? Yes. Standard FR-4 suits most applications below 130°C continuous. High-Tg FR-4 or polyimide only needed for high-temperature environments or CTE matching under extreme thermal cycling.
How many flex cycles should I design for? Static flex (bent once): 10–100 cycles, adhesive-based fine. Dynamic flex: design for 10× expected lifetime cycles (e.g., 5,000 opens over 5 years → 50,000 cycles, adhesiveless required).
Minimum bend radius? Standard is 10× total flex thickness. For 0.2mm (8 mil) flex, minimum is 2mm. Specifying 15× or 20× reduces cost and improves reliability.
IPC Class 2 or Class 3? Class 2 for most consumer/industrial. Class 3 for medical implantables, aerospace, military—adds 15–25% cost.
What causes procurement delays? DFM engineering queries (1–3 days/iteration), non-standard material procurement (3–7 days), failed electrical testing (2–5 days), inadequate documentation (1–2 days). Early DFM review prevents most delays.
Conclusion: Design Review Checklist
Reducing rigid-flex PCB costs by 30% is achievable through: layer count optimization, material selection, tolerance relaxation, panelization, and early supplier collaboration.
Before submitting your next order:
- Can any layers be removed from flex sections?
- Are material grades justified by actual operating conditions?
- Do tolerances exceed what’s functionally required?
- Is panel utilization optimized above 80%?
- Have you obtained DFM feedback from your supplier?
About the Author
This guide is based on 15+ years of CAM engineering and DFM experience in rigid-flex PCB manufacturing across consumer, industrial, medical, and aerospace applications. Cost data reflects real-world production analysis from prototype through volume manufacturing.