What is the use of eye diagram in PCB design?
Eye diagram is formed by overlapping each code element waveform obtained by scanning due to the afterglow effect of oscilloscope. This article will lead you to understand what eye diagram is on PCB, how eye diagram is formed, what information is contained in eye diagram, and how to distinguish signal quality according to eye diagram. To understand oscilloscope eye diagram, you need to master the following 4 points:
1.What is eye diagram?
Eye diagram is a series of digital signals accumulated and displayed on the oscilloscope. It contains rich information. From the eye diagram, you can observe the influence of inter-code crosstalk and noise, which reflects the overall characteristics of digital signals, so as to estimate the pros and cons of the system.
Therefore, eye diagram analysis is the core of signal integrity analysis of high-speed interconnection system.
In addition, this graph can also be used to adjust the characteristics of the receiving filter to reduce inter-code crosstalk and improve the transmission performance of the system. Use an oscilloscope to bridge the output end of the receiving filter, and then adjust the oscilloscope scanning cycle to synchronize the horizontal scanning cycle of the oscilloscope with the cycle of the received code element. At this time, the graph seen on the oscilloscope screen is called an eye diagram.
The signal generally measured by the oscilloscope is a waveform of some bits or a certain period of time, which reflects more detailed information, while the eye diagram reflects the overall characteristics of all digital signals transmitted on the link. The method of observing the eye diagram is: use an oscilloscope to bridge the output end of the receiving filter, and then adjust the oscilloscope scanning cycle to synchronize the horizontal scanning cycle of the oscilloscope with the cycle of the receiving code element. At this time, the figure seen on the oscilloscope screen looks like a human eye, so it is called an “eye diagram”. From the “eye diagram”, the influence of inter-code crosstalk and noise can be observed, so as to estimate the quality of the system.
In addition, this figure can also be used to adjust the characteristics of the receiving filter to reduce inter-code crosstalk and improve the transmission performance of the system.
2.Formation of the eye diagram
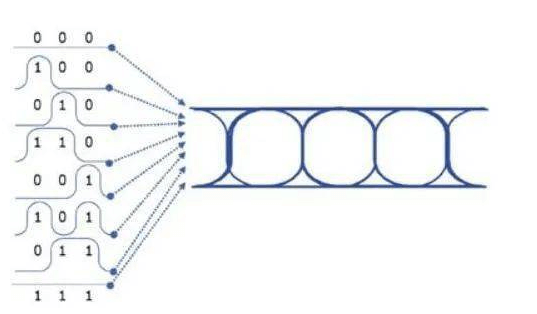
For digital signals, the changes in high and low levels can have multiple sequence combinations. Taking 3 bits as an example, there can be 8 combinations of 000-111. In the time domain, align enough of the above sequences according to a certain reference point, and then superimpose their waveforms to form an eye diagram.
As shown in the figure below, for the test instrument, the clock signal of the signal is first recovered from the signal to be tested, and then the eye diagram is superimposed according to the clock reference, and finally displayed.
3.Information contained in the eye diagram
For a real eye diagram, as shown in the figure below, we can first see the basic level conversion parameters such as the average rise time (Rise Time), fall time (Fall Time), overshoot (Overshoot), undershoot (Undershoot), threshold level (Threshold/Crossing Percent) of the digital waveform.
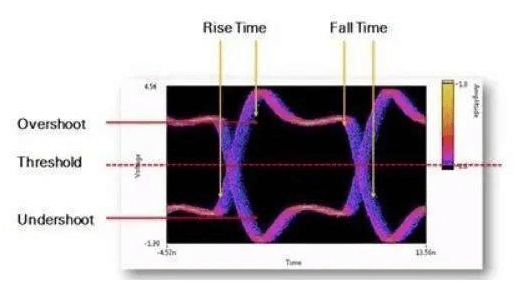
Rise time (Rise Time): The rise time of the pulse signal refers to the interval between the two instants when the instantaneous value of the pulse first reaches the specified lower limit and the specified upper limit. Unless otherwise specified, the lower limit and upper limit are set to 10% and 90% of the pulse peak amplitude respectively.
Fall time (Fall Time): The fall time of the pulse signal refers to the time interval from 90% to 10% of the pulse peak amplitude.
Overshoot (Overshoot): Also called overshoot, it means that the first peak or valley value exceeds the set voltage, which is mainly manifested as a sharp pulse and can cause the failure of circuit components.
Undershoot: refers to the next valley or peak value. Excessive overshoot can cause the protection diode to work, resulting in premature failure. Excessive undershoot can cause false clock or data errors.
Threshold/Crossing Percent: refers to the lowest receiving level that the receiver can reach when the system transmission characteristics are inferior to a certain bit error rate.
How to distinguish signal quality based on the eye diagram
It is impossible for the voltage values of the high and low levels of the signal to remain completely consistent every time, and it is also impossible to guarantee that the rising and falling edges of each high and low level are at the same time.
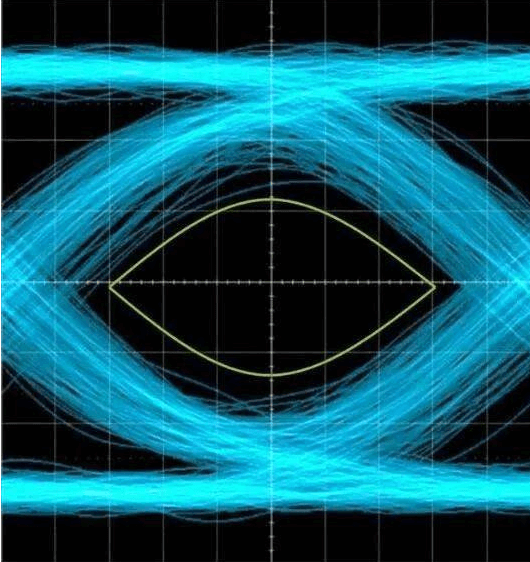
Due to the superposition of multiple signals, the signal line of the eye diagram becomes thicker and blurry. Therefore, the eye diagram also reflects the noise and jitter of the signal: on the vertical voltage axis, it is reflected as voltage noise (Voltage Noise); on the horizontal time axis, it is reflected as jitter in the time domain (Jitter). As shown in the figure below.
When there is noise, the noise will be superimposed on the signal, and the line trace of the observed eye diagram will become blurred. If there is also inter-symbol crosstalk, the “eye” will open smaller. Generally, the larger the eye of the eye diagram is, the higher the eye height is, which means the better the signal quality is.
Signal simulation can obtain the eye diagram, and then judge the signal quality based on the eye diagram. If the eye diagram is not good, the hardware design or PCB design can be adjusted to make the eye height higher to ensure the signal quality of the produced product.